scTenifoldNet
scTenifoldNet: A Machine Learning Workflow for Constructing and Comparing Transcriptome-wide Gene Regulatory Networks from Single-Cell Data
See Patterns paper for more information.
scTenifoldNet in R
Installation
In an R shell, type:
install.packages("scTenifoldNet")
Basic Use
library(scTenifoldNet)
library(Matrix)
X <- read.csv('X1.csv', header = FALSE)
colnames(X) <- paste0('X1_', seq_len(ncol(X)))
X <- as.matrix(X)
Y <- read.csv('X2.csv', header = FALSE)
colnames(Y) <- paste0('X2_', seq_len(ncol(Y)))
Y <- as.matrix(Y)
rownames(X) <- rownames(Y) <- readLines('genelist.csv')
set.seed(1)
DR <- scTenifoldNet(X = X, Y = Y)
save(DR, file = 'netOut.RData')
write.csv(DR$diffRegulation, row.names = FALSE, file = 'netResult.csv')
scTenifoldNet in MATLAB
Installation
Run the following code in MATLAB:
tic
disp('Installing scTenifoldNet...')
unzip('https://github.com/cailab-tamu/scTenifoldNet/archive/master.zip');
addpath('./scTenifoldNet-master/MATLAB');
toc
if exist('sctenifoldnet_m.m','file')
    disp('scTenifoldNet installed!')
end
Basic Use
Run ‘SCTENIFOLDNET` with an example data file clean_data_1Ctl_2FgF2.mat in MATLAB:
load clean_data_1Ctl_2FgF2.mat
sce=sce.selectgenes(1,0.15);
sce=sce.qcfilter;

%%
X0=sce.X(:,sce.c_batch_id==1);
X1=sce.X(:,sce.c_batch_id==2);
T=sctenifoldnet(X0,X1,sce.g,'savegrn',true);
writetable(T,'resT.txt');
Tr=e_fgsearun(T);
writetable(Tr,'resTr.txt');
tgenes=T.genelist(T.pAdjusted<0.1);
e_fgseanet(Tr);

load(ls('A0_*.mat'))
[y,i]=isemember(tgenes,genelist);
assert(all(y))
a0=A0(i,i);

load(ls('A1_*.mat'))
[y,i]=isemember(tgenes,genelist);
assert(all(y))
a1=A1(i,i);

g1=digraph(a1,tgenes,'omitselfloops');
g2=digraph(a2,tgenes,'omitselfloops');
gui.i_doublegraphs(g1,g2);
scTenifoldNet in Julia
Installation
Run the following code in Julia:
using Pkg
Pkg.add(PackageSpec(url="git://github.com/jamesjcai/ScTenifold.jl.git"))
Pkg.test("ScTenifold")
# or
# ] add https://github.com/jamesjcai/ScTenifoldNet.jl
Basic Use
Here is a simple example using randomly generated data.
using ScTenifold
using DelimitedFiles
# cd(dirname(@__FILE__))

X1=rand(100,1000);
X2=copy(X1);
X2[4,:].=0.0;
@time d,fc,p,adjp=ScTenifold.sctenifoldnet(X1,X2,donorm=false)

open("output_small.txt", "w") do io
    writedlm(io, [d fc p adjp])
end
Exported Functions
Code |
Function |
|---|---|
pcnet |
Computes a gene regulatory network based on principal component regression |
tensordecomp |
Performs CANDECOMP/PARAFAC (CP) Tensor Decomposition |
manialn |
Performs non-linear manifold alignment of two gene regulatory networks |
drgenes |
Evaluates gene differential regulation based on manifold alignment distances |
tenrnet |
Subsamples cells, constructs single-cell gene regulatory networks (scGRNs) using principal component regression (pcnet), and denoises scGRNs using tensor decomposition (tensordecomp). |
Loading ScTenifoldNet
Once installed, ScTenifoldNet.jl can be loaded typing:
using ScTenifoldNet
Simulating of a dataset
Here we simulate a dataset of 2000 cells (columns) and 100 genes (rows) following the negative binomial distribution with high sparsity (~67%).
d=NegativeBinomial(20,0.98)
X=rand(d,100,2000)
Generating a perturbed network
We generate a perturbed network modifying the expression of genes 10, 2, and 3 and replacing them with the expression of genes 50, 11, and 5.
Y=copy(X)
Y[10,:]=Y[50,:]
Y[2,:]=Y[11,:]
Y[3,:]=Y[5,:]

X=X[:,vec(sum(X,dims=1).>30)]
Y=Y[:,vec(sum(Y,dims=1).>30)]
Generating networks
Here we run ScTenifoldNet under the H0 (there is no change in the regulation of the gene) using the same matrix as input and under the HA (there is a change in the regulation of the genes) using the control and the perturbed network.
Z0=ScTenifoldNet.tenrnet(X, donorm=true)
Z1=ScTenifoldNet.tenrnet(Y, donorm=true)
Differential regulation based on manifold alignment distances
As is shown below, under the H0, none of the genes shown a significative difference in regulatory profiles using an FDR cut-off of 0.1, but under the HA, the 6 genes involved in the perturbation (50, 11, 2, 10, 5, and 3) are identified as perturbed.
d,aln0,aln1=ScTenifoldNet.manialn(Z0,Z1)
fc,p,adjp=ScTenifoldNet.drgenes(d)
Plotting the results
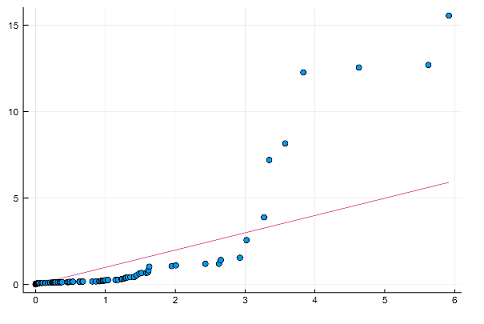
using StatsPlots, Distributions
x=rand(Chisq(1), length(fc))
qqplot(x, fc)